IJAI Research Article • Computer Vision • Public Health Informatics
DECK 01 • 01/12
Deep Learning & Nutritional Intelligence

Food Recognition & Nutrition Estimation:
YOLO Approach on Food-101 Dataset

An image-based multi-object deep learning framework comparing YOLOv8, YOLOv11, and YOLOv12, seamlessly mapped to the Indonesian Food Composition Table (TKPI) and NutriSurvey for real-time school meal accountability.

Research Authors & Affiliations
Dewi Nasien1, M. Hasmil Adiya1, Erlin1, Rahmi Pramulia Fitri2
1Dept. of Informatics Engineering, IBT Pelita Indonesia, Riau
2Dept. of Public Health, STIKes Payung Negeri Pekanbaru, Riau
99.6%
mAP@50 (v12)
101K
Benchmark
<2s
Inference
International Journal of Advances in Intelligent Informatics (IJAI) 01 / 12
Research Motivation • The Dietary Monitoring Paradox
DECK 01 • 02/12
Problem Statement

Vital for Human Survival. Broken in Daily Practice.

Food intake determines metabolic equilibrium and shields against chronic diseases (obesity, diabetes, hypertension, stunting). Yet monitoring food quality and portions at scale remains nearly impossible with manual tools.

45M+
Students Needing Daily Audits
0
Automated Tools in Community
“No practical tools currently exist to deliver rapid and accurate nutritional information in daily settings.” — Doulah et al. [5]
The Conventional Bottleneck (Manual Logging)
Status Quo

Manual food diaries and 24-hour recall depend heavily on subjective user memory. They are tedious, error-prone, and unsustainable for large-scale institutional school feeding supervision.

High Recall Bias Zero Portability Untracked Rations
The Computer Vision & AI Opportunity
Our Proposed Work

Digital meal images provide non-invasive visual cues (color, geometry, texture). By coupling YOLO multi-object detection with the Indonesian Food Composition Table (TKPI), this study creates an objective, instant pipeline for dietary governance.

Sub-2s Speed 12 Nutrients 100% Objective
Clinical Rationale & Public Health Motivation 02 / 12
Technical Dilemma DECK 01 • 03/12
Classification vs Detection

The Multi-Item Food Plate Dilemma

Why existing single-label CNN models break down on real cafeteria trays.

Conventional CNNs Single-Item Assumption

Most academic food recognition research applies single-label image classification. They assume 1 photo = 1 dish.

Failure Mode: Real school meal trays combine rice, chicken, vegetables, tofu, and fruits. A global CNN fails to decompose the plate into individual nutritional components.
One-Stage YOLO Detector Simultaneous Multi-Dish

YOLO processes the complete meal plate in a single forward inference pass, predicting multi-scale bounding boxes and class labels directly.

Speed & Accuracy: Eliminates slow region proposal stages (unlike Faster R-CNN/Mask R-CNN), ensuring real-time cafeteria throughput without missed dishes.
Bounding Box Localization vs Whole-Image Classification 03 / 12
Research Objectives DECK 01 • 04/12
Milestones & Contributions

Four Pillars of Our Investigation

Systematic transition from raw pixels to institutional dietary governance.

01

Benchmark Dataset Annotation

Curating Food-101 into multi-dish bounding box detection format via Roboflow, establishing an 80% train / 20% validation split.

02

Comparative YOLO Benchmarking

Training and empirically comparing YOLOv8, YOLOv11, and YOLOv12 across mAP@50, precision, recall, and F1-score metrics.

03

Indonesian Nutrition Mapping

Coupling detected class predictions to the Indonesian Food Composition Table (TKPI) and NutriSurvey for 12 key nutrients.

04

End-to-End System Deployment

Building a field-ready web interface with dual-AI reasoning (Gemini LLM) and Filament administrative daily audit tracking.

Empirical Contributions & System Scope 04 / 12
Methodology DECK 01 • 05/12
Empirical Framework

Research Framework: Figure 1 Architecture
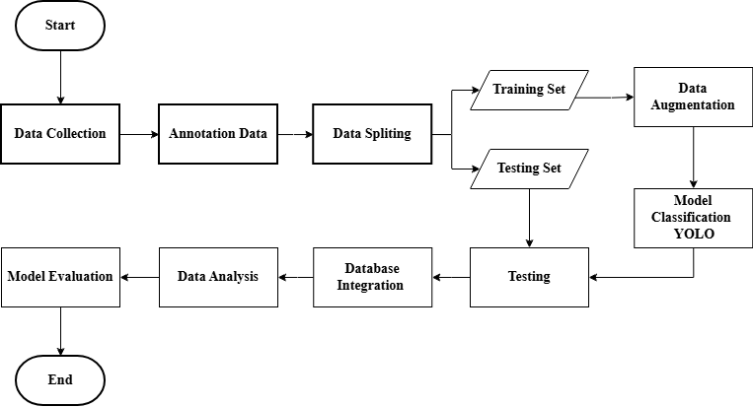
Research Framework Figure 1: Research Framework (Dewi Nasien et al., 2026)
Stage 1 • Data Curation

Food-101 dataset annotated with bounding boxes in Roboflow and divided into 80% train / 20% validation splits.

Stage 2 • Model Training

YOLOv8, YOLOv11, and YOLOv12 trained on augmented inputs (640x640 resolution) across identical evaluation criteria.

Stage 3 • Nutrition Integration

Predicted food labels matched against Indonesian TKPI & NutriSurvey databases to calculate macro and micro nutrients.

Stage 4 • Web Deployment

Responsive web portal for real-time mobile camera capture, nutrition scoring, and administrative audit trails.

Experimental Pipeline & Relational Nutrition Mapping 05 / 12
Data Engineering DECK 01 • 06/12
Benchmark Preparation

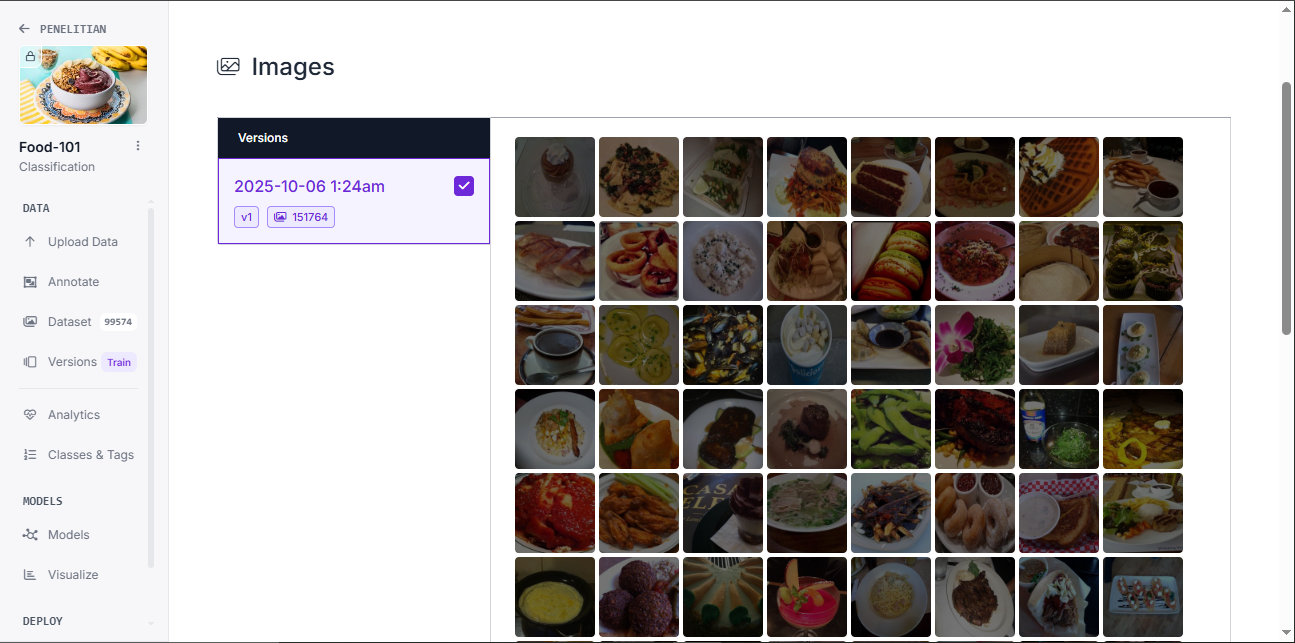
Dataset Curation with Roboflow

Managing the Food-101 benchmark: 101 categories, 101,000 images, and spatial bounding box labeling.
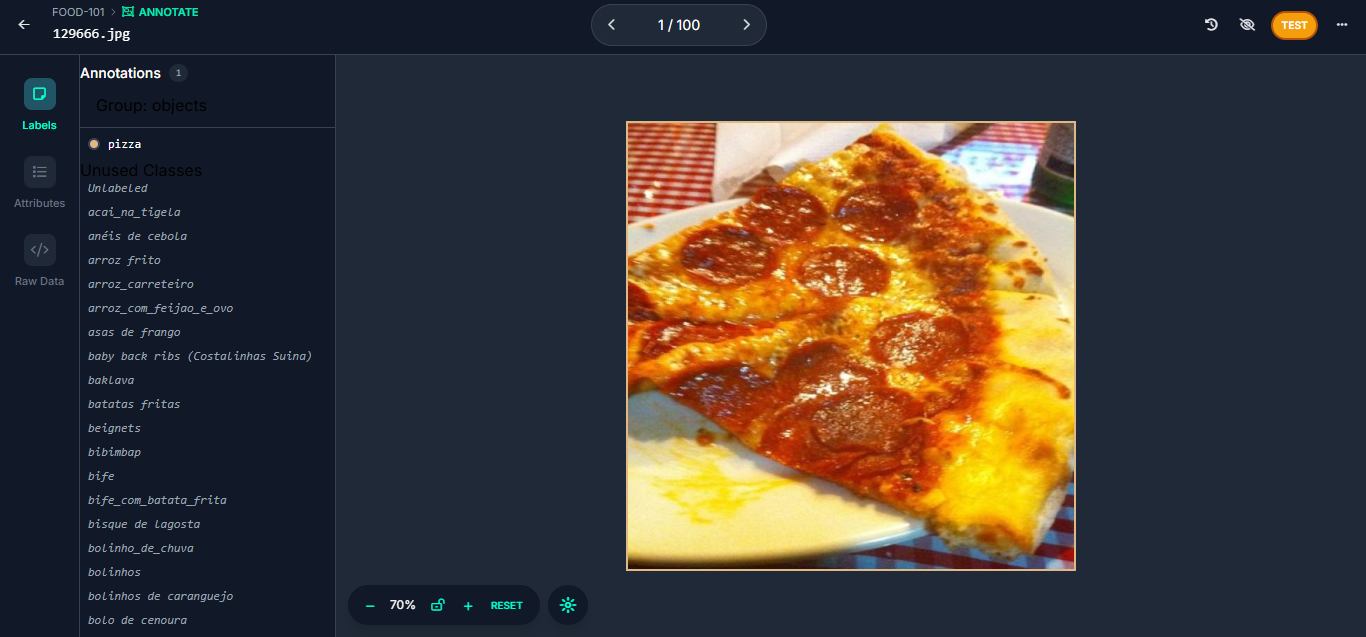
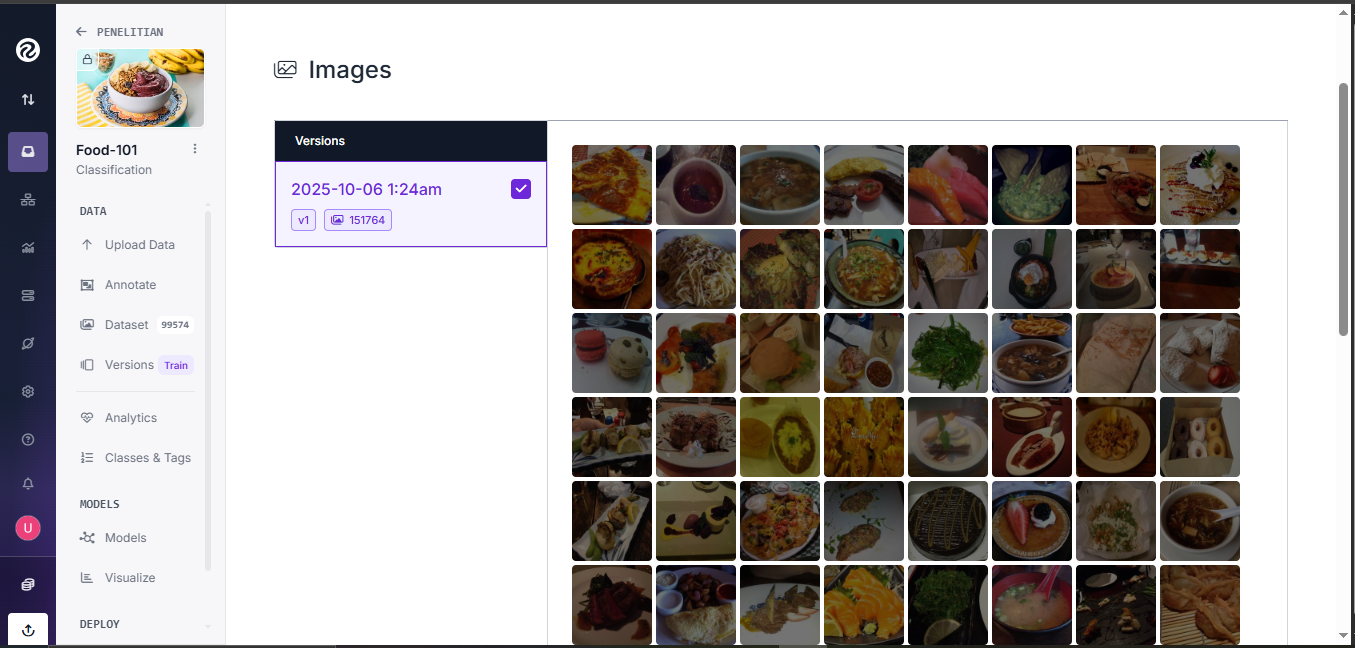
Bounding Box Annotation
Fig 3(a): Annotation
Tight spatial coordinate labeling per food dish item.
Training Dataset
Fig 3(b): 80% Train Split
Subjected to standard augmentations (flips & resize).
Validation Dataset
Fig 3(c): 20% Val Split
Unseen validation images to assess generalization.
Standardized 80/20 Train-Validation Strategy 06 / 12
Architecture Spec Sheet DECK 01 • 07/12
Deep Learning Evolution

YOLOv8 vs YOLOv11 vs YOLOv12

Evaluating architectural advances across one-stage object detection backbones.

YOLOv8 Baseline

Anchor-free detection head with C2f modules. Balances feature extraction and inference speed, but has lower recall on crowded plates.

Recall: 94.7% • mAP@50: 96.2%
YOLOv11 Efficiency

Integrates C3k2 building blocks and optimized SPPF pooling. Demonstrates faster convergence and improved boundary delineation.

Recall: 96.3% • mAP@50: 98.8%
YOLOv12 Best Performer

Introduces area attention mechanisms into feature representations. Effectively reduces missed detections across overlapping mixed dishes.

Recall: 97.1% • mAP@50: 99.6%
Anchor-Free Single Stage Architectural Evolution 07 / 12
Experimental Findings DECK 01 • 08/12
Table 1 Empirical Data

Performance Comparison of YOLO Models

Model mAP@50 Precision Recall F1
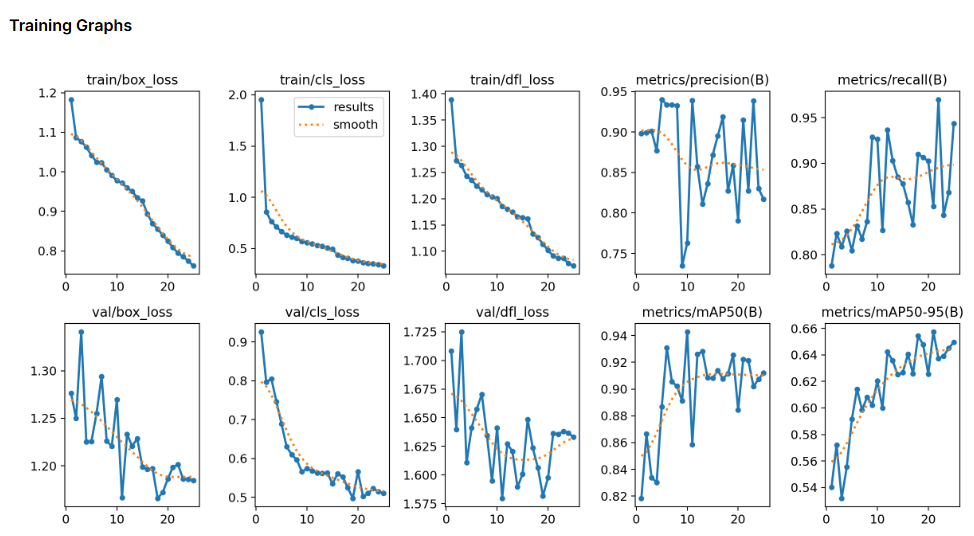
YOLOv8 96.2% 99.1% 94.7% 96.7%
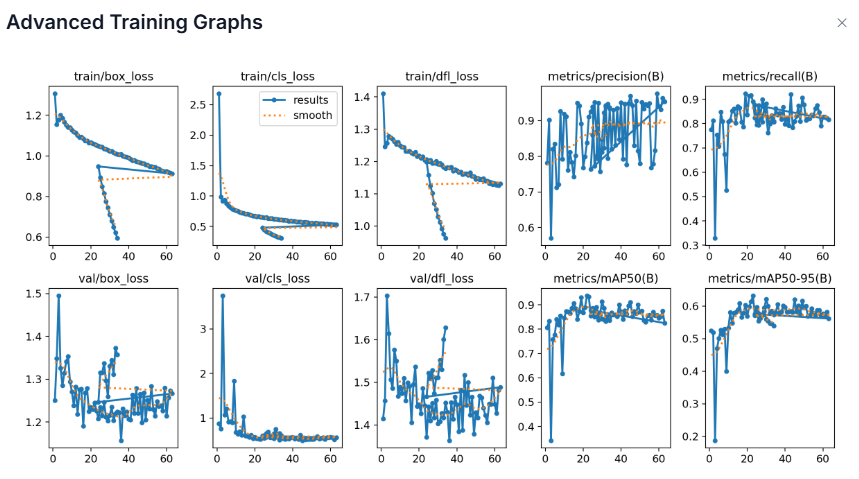
YOLOv11 98.8% 99.2% 96.3% 97.6%
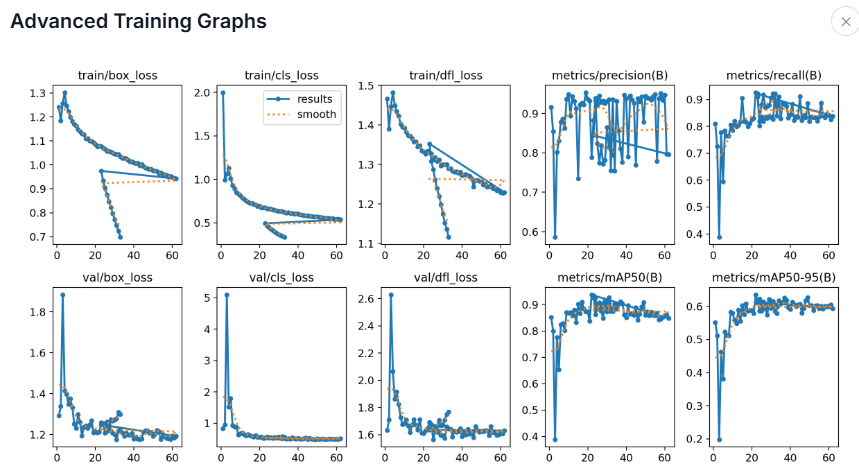
YOLOv12 99.6% 99.2% 97.1% 98.0%
Recall Significance: High recall (97.1%) minimizes unobserved dishes on the tray, preventing underestimation in cumulative caloric auditing.
YOLOv8 Curves YOLOv8
YOLOv11 Curves YOLOv11
YOLOv12 Curves YOLOv12 (Peak)
Empirical Proof: YOLOv12 Delivers Superior Detection Quality 08 / 12
Nutritional Intelligence DECK 01 • 09/12
Relational Mapping

TKPI & NutriSurvey Knowledge Engine

Translating bounding-box object detections into clinical macronutrient and micronutrient profiles.

Indonesian TKPI Database

Anchored to the official Tabel Komposisi Pangan Indonesia (Kemenkes RI) for regionally authentic ingredients and cooking methods.

12 Parameter Breakdown

Computes Energy (kcal), Protein, Fat, Carbohydrates, Dietary Fiber, Sodium, Potassium, Calcium, Iron, and Vitamins A & C.

AKG Lunch Standard

Automatically benchmarks total meal intake against the required 30-35% daily nutritional allowance for school lunch rations.

Portion Weight Assumption: Nutritional estimates use standard institutional serving grammages mapped per recognized class. Kemenkes Compliant
Clinical Dietary Composition Framework 09 / 12
System Demonstration DECK 01 • 10/12
Case Study

Real-World 5-Dish Meal Tray Inference

Demonstrating Figure 6 from publication: 5 detected dishes on a single cafeteria plate.
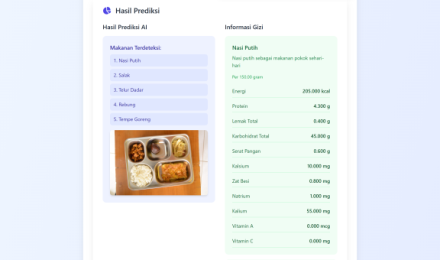
Detected Food Items Figure 6(b): Multi-Food Detection Bounding Boxes
🍚 White Rice (100g) 130 kcal
🍳 Egg Omelette (70g) 210 kcal
🎋 Bamboo Shoot (100g) 45 kcal
🤎 Fried Tempeh (50g) 150 kcal
🐍 Snakefruit / Salak (80g) 62 kcal
Dual-AI: LLM Clinical Reasoning Score
Meal Balance Score: 92/100 • Complete Macronutrient Profile
597 kcal
Empirical Case Study: 5-Item Indonesian Meal Tray 10 / 12
Public Health Implementation DECK 01 • 11/12
Scaling Across Schools

National Impact: Free Nutritious Meal (MBG) Program

Safeguarding nutritional sufficiency and financial accountability for millions of students.

01. Kitchen

Catering Verification

Portion verification and photo registration before food dispatch.

02. School Gate

Rapid Acceptance

Sub-2 second camera verification by teachers prior to student consumption.

03. Backoffice

Daily Digital Reports

Photographic logs and attendance recorded in Filament 3.

04. Government

District Oversight

Transparent regional dashboards eliminating fraud and meal waste.

Institutional Governance & Multi-Tier Accountability 11 / 12
Conclusions DECK 01 • 12/12
Final Takeaways

Conclusions & Future Research

Validated breakthroughs and future directions for edge nutrition monitoring.

Validated Breakthroughs

YOLOv12 achieved superior metrics (99.6% mAP@50, 98.0% F1), proving one-stage detection solves the multi-dish recognition dilemma.

Scope & Boundaries

Nutritional values currently derive from detected classes and standard portion grammages rather than 3D volumetric depth.

Future Roadmap

Edge deployment (TensorRT/ONNX) for offline 3T schools, IoT smart kitchen scale calibration, and food waste detection.

Launch AI Detection Demo
Q&A Session Open • Research Team Pelita Indonesia & STIKes Payung Negeri 12 / 12
Notification